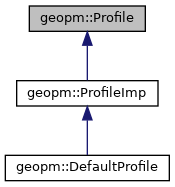
Enables application profiling and application feedback to the control algorithm.
More...
|
| | Profile ()=default |
| |
| virtual | ~Profile ()=default |
| |
| virtual uint64_t | region (const std::string ®ion_name, long hint)=0 |
| | Register a region of code to be profiled.
|
| |
| virtual void | enter (uint64_t region_id)=0 |
| | Mark a region entry point.
|
| |
| virtual void | exit (uint64_t region_id)=0 |
| | Mark a region exit point.
|
| |
| virtual void | epoch (void)=0 |
| | Signal pass through outer loop.
|
| |
| virtual void | shutdown (void)=0 |
| |
| virtual void | thread_init (uint32_t num_work_unit)=0 |
| | Update the total work for all CPUs. This method should be called by one thread in the same parallel region with the total work units expected to be completed by the entire group.
|
| |
| virtual void | thread_post (int cpu)=0 |
| | Mark one unit of work completed by the thread on this CPU.
|
| |
| virtual std::vector< std::string > | region_names (void)=0 |
| |
| virtual void | reset_cpu_set (void)=0 |
| |
| virtual void | overhead (double overhead_sec)=0 |
| |
| virtual void | connect (void)=0 |
| |
Enables application profiling and application feedback to the control algorithm.
The information gathered by the Profile class identifies regions of code, progress within regions, and global synchronization points in the application. Regions of code define periods in the application during which control parameters are tuned with the expectation that control parameters for a region can be optimized independently of other regions. In this way a region is associated with a set of control parameters which can be optimized, and future time intervals associated with the same region will benefit from the application of control parameters which were determined from tuning within previous occurrences of the region. There are two competing motivations for defining a region within the application. The first is to identify a section of code that has distinct compute, memory, or network characteristics. The second is to avoid defining these regions such that they are nested within each other, as nested regions are ignored and only the outer most region is used for tuning when nesting occurs. Identifying progress within a region can be used to alleviate load imbalance in the application under the assumption that the region is bulk synchronous. Under the assumption that the application employs an iterative algorithm which synchronizes periodically the user can alleviate load imbalance on larger time scales than the regions provide. This is done by marking the end of the outer most loop, or the "epoch."
The Profile class is the C++ implementation of the computational application side interface to the GEOPM profiler. The class methods support the C interface defined for use with the geopm_prof_c structure and are named accordingly. The geopm_prof_c structure is an opaque reference to the Profile class.
| virtual uint64_t geopm::Profile::region |
( |
const std::string & |
region_name, |
|
|
long |
hint |
|
) |
| |
|
pure virtual |
Register a region of code to be profiled.
The statistics gathered for each region are aggregated in the final report, and the power policy will be determined distinctly for each region. The registration of a region is idempotent, and the first call will have more overhead than subsequent attempts to re-register the same region.
- Parameters
-
| [in] | region_name | Unique name that identifies the region being profiled. This name will be printed next to the region statistics in the report. |
| [in] | hint | Value from the #geopm_hint_e structure which is used to derive a starting policy before the application has been profiled. |
- Returns
- Returns the region_id which is a unique identifier derived from the region_name. This value is passed to Profile::enter() and Profile::exit() to associate these calls with the registered region.
Implemented in geopm::ProfileImp.
